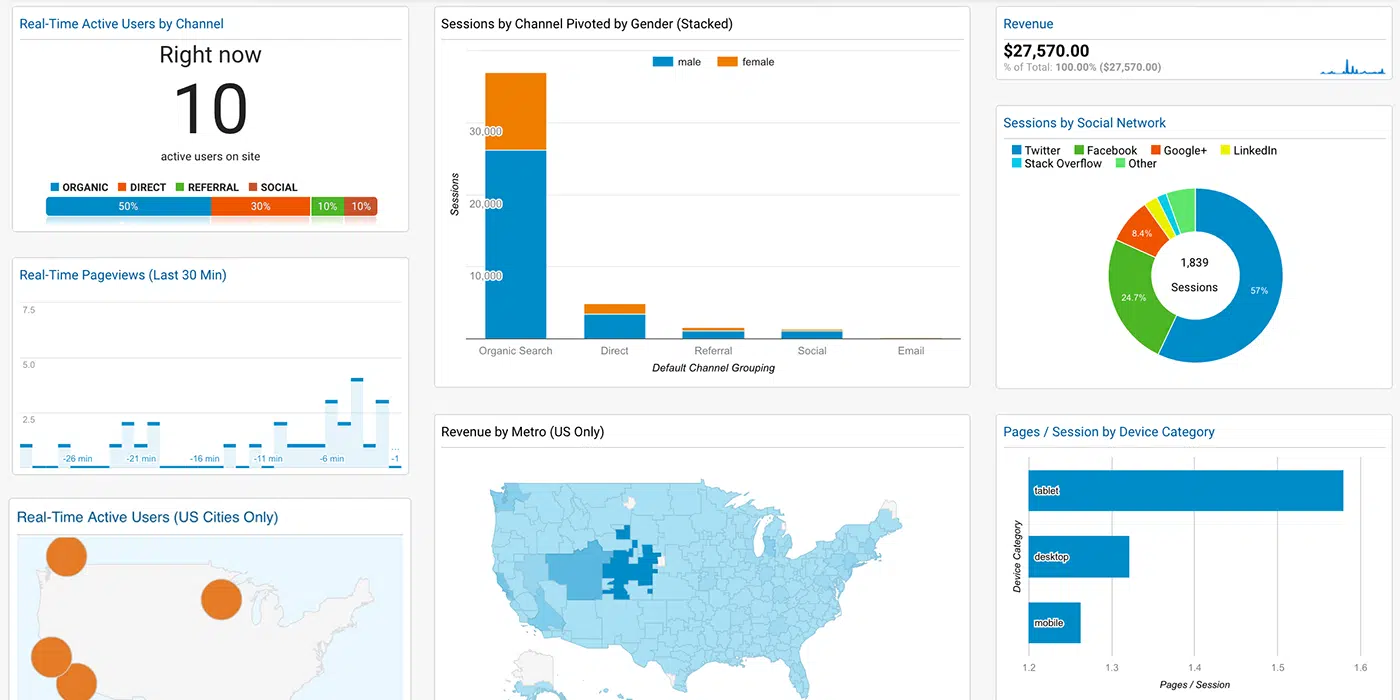
Google Analytics… A very useful and, in addition, free tool for them website owners, yet so complicated to understand? Do not worry, at the end of this article you will have understood at least the basics and beyond are up to you either to familiarize yourself with this and learn to interpret its data, or of course to entrust it to a professional who knows how to analyze everything and will help you to customize your page based on the needs of your audience.
What exactly is Google Analytics ?
Google Analytics is a platform for analyzing site statistics that is offered free of charge by Google and can be easily placed by copying and pasting the code provided to us, on each page we want to monitor.
Some of the benefits of GA are:
- It can track the number of visitors to each site or blog,
- the average time they spent in it,
- information about their country of origin and
- from what source do they come to you,
- Which pages do they interact with the most and which ones do they pay the least attention to
- which keywords led them to you and are the most profitable and
- how effective your SEO is

So let’s start analyzing its features.
Audience overview
Displays the traffic of your site during the last month. At the top of the graph there is also the option to change the time period if you want to see other time intervals specific dates.
Sessions – The total site visits as well as all user interactions with it during that visit. That is, if a user has visited the page 5 times within the date we have chosen, he will be recorded in the sessions not as a single visit but as 5 separate ones.
Users – The visitors of your site. The exact number of users who have visited you. No matter how many times they have visited the page, in the statistics they will be recorded as one user.
Pageviews – The set of pages that have been displayed to users.
Pages / Session – The average number of pages each user visited in one visit.
Avg. Session Duration – The average number of users your site stays on it per visit.
Bounce rate – The percentage of users who leave the page immediately after visiting (without visiting another page).
% New Sessions – The percentage of new visitors to your page.
Demographics – The demographics of users with details – their age and gender. In this section you can also select specific dates and watch for example up to the average visit of women aged 39-44 during this time. This section is very important because it helps us to understand if we are guided correctly based on the goals we have set in order to attract the right audience each time but also to review our goals if another audience emerges (based on age or gender) from what we wanted to attract from the beginning.
Interests – The interests of the users of your page. This section also helps to understand if you attract the audience you want and to see exactly what they like but also to adapt your content accordingly.
Geo – The geographical data of the users – their language and location. An equally important section which helps to control the impact that your page has in your country but at the same time to see from where else in the world they visit you. With this information you will be able to understand if there is a prospect of “opening” in other countries, or the need to include in the menu a language other than the one you already provide in order to adapt to the needs of your audience. In this section you are given a world map in which you can see the results in total and by country / region.
Behavior – How users behave when they visit your page. If they return to it or leave immediately and are looking for what they want elsewhere, if they are really concerned with its content and finally, monitor the new visitors. Having a good percentage of new and old people who return to your page again shows that you are using your SEO properly and that the content of your page is valid and interesting, so make sure you keep these percentages high. The engagement section gives you additional information about how long the visits last and how many pages your users visit each time.
Technology – From which browsers visitors visit your site, which operating system and which network they use. This section will help you understand if your page works well and in which browsers. If some of the basics (the ones most often preferred by users like Chrome, Mozilla Firefox) appear lower in the list it may indicate some incompatibility with it so you should check it and move accordingly.
Mobile – In this category you are provided with the information about the medium your users prefer to use to surf your page. Because most internet users now use their smartphone to navigate the web, you need to make sure your page is mobile friendly and adapts just as well to all mobile devices to offer a comfortable and carefree browsing experience.
Users Flow – User flow. Aggregate diagram data that shows you what users are doing from the moment they enter your site until they leave it. In the upper left part of this section there is an option to change the country you want to view in the chart and examine how visitors come to your page (the landing page), from which point they located you (the source) to and from which social network they landed on your page. Drop offs are the “problematic” points of the site, the points where users leave your site. For example, users may find a problem with your site’s contact form, get stuck at some point, or not be able to complete their registration so they can leave the site after some effort. It is a very important element in order to find out what these problematic points are and make the necessary corrections in order to reduce the bounce rate. It is prudent to pay special attention to this section, as this one will offer you a complete picture of your site.
We hope you have helped in the understanding of this important ‘Google Analytics’ platform. Depending on how dedicated you are to the interpretation of the data, the closer you will be to your audience and you will have better results !


